

The Psychokinesis Hypothesis
and why the scientific evidence does not support it
The funnel plot
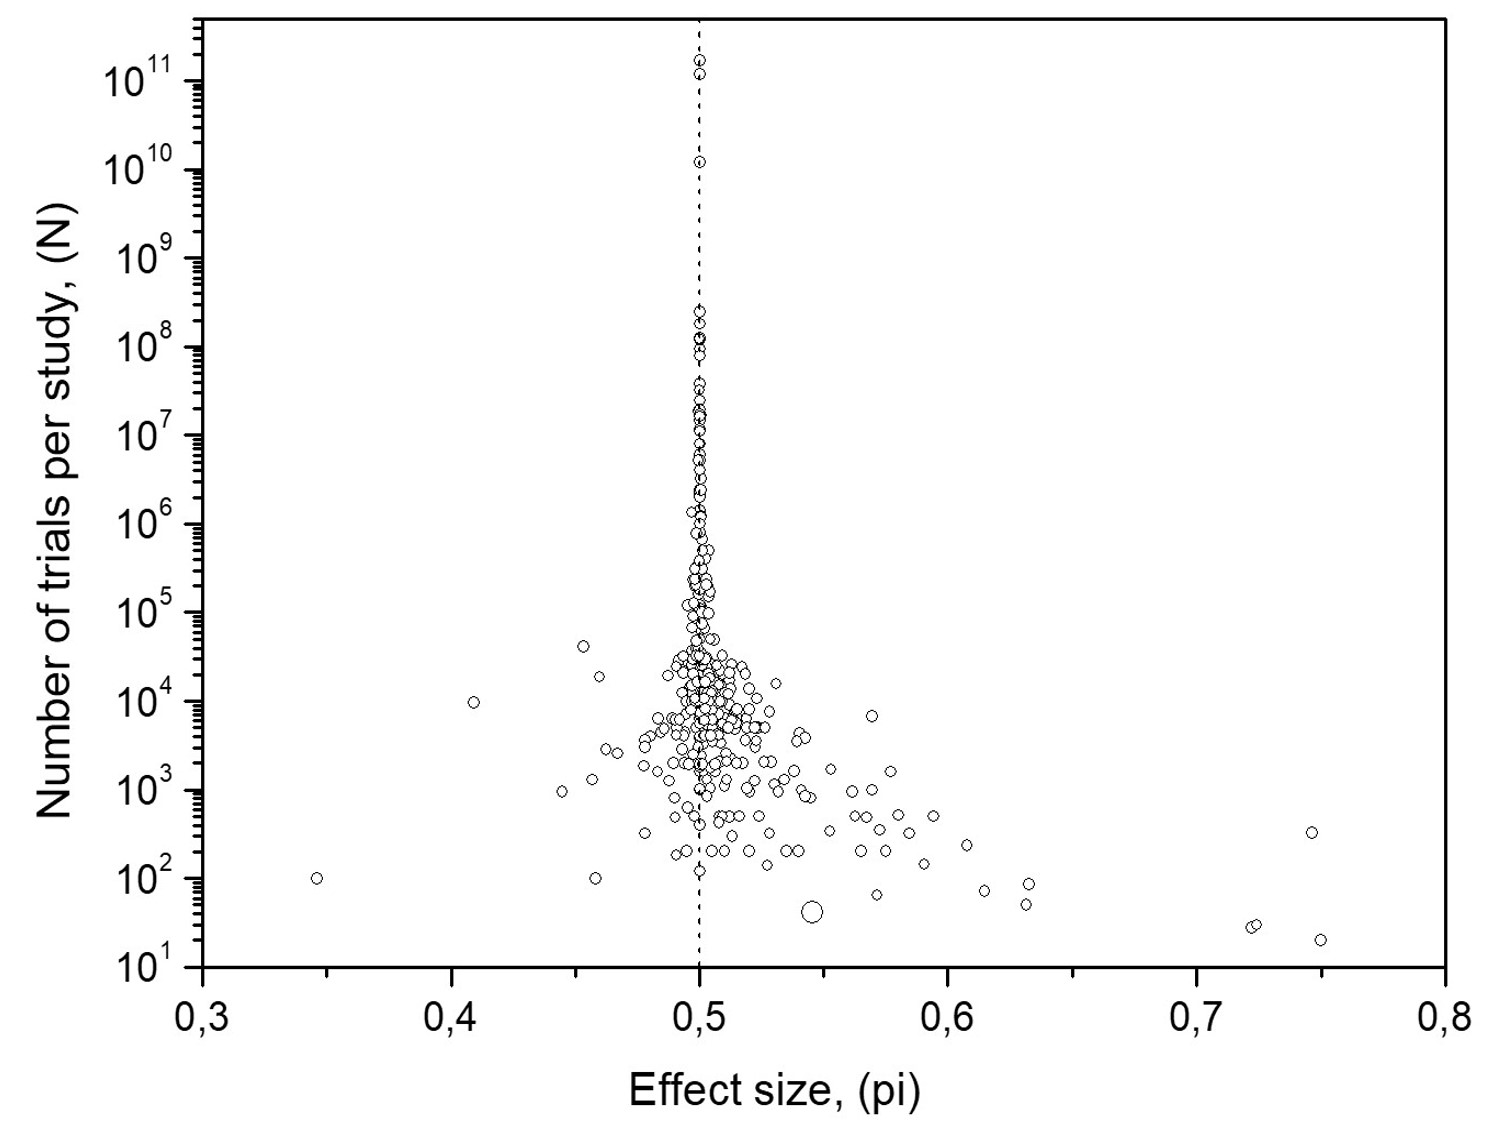
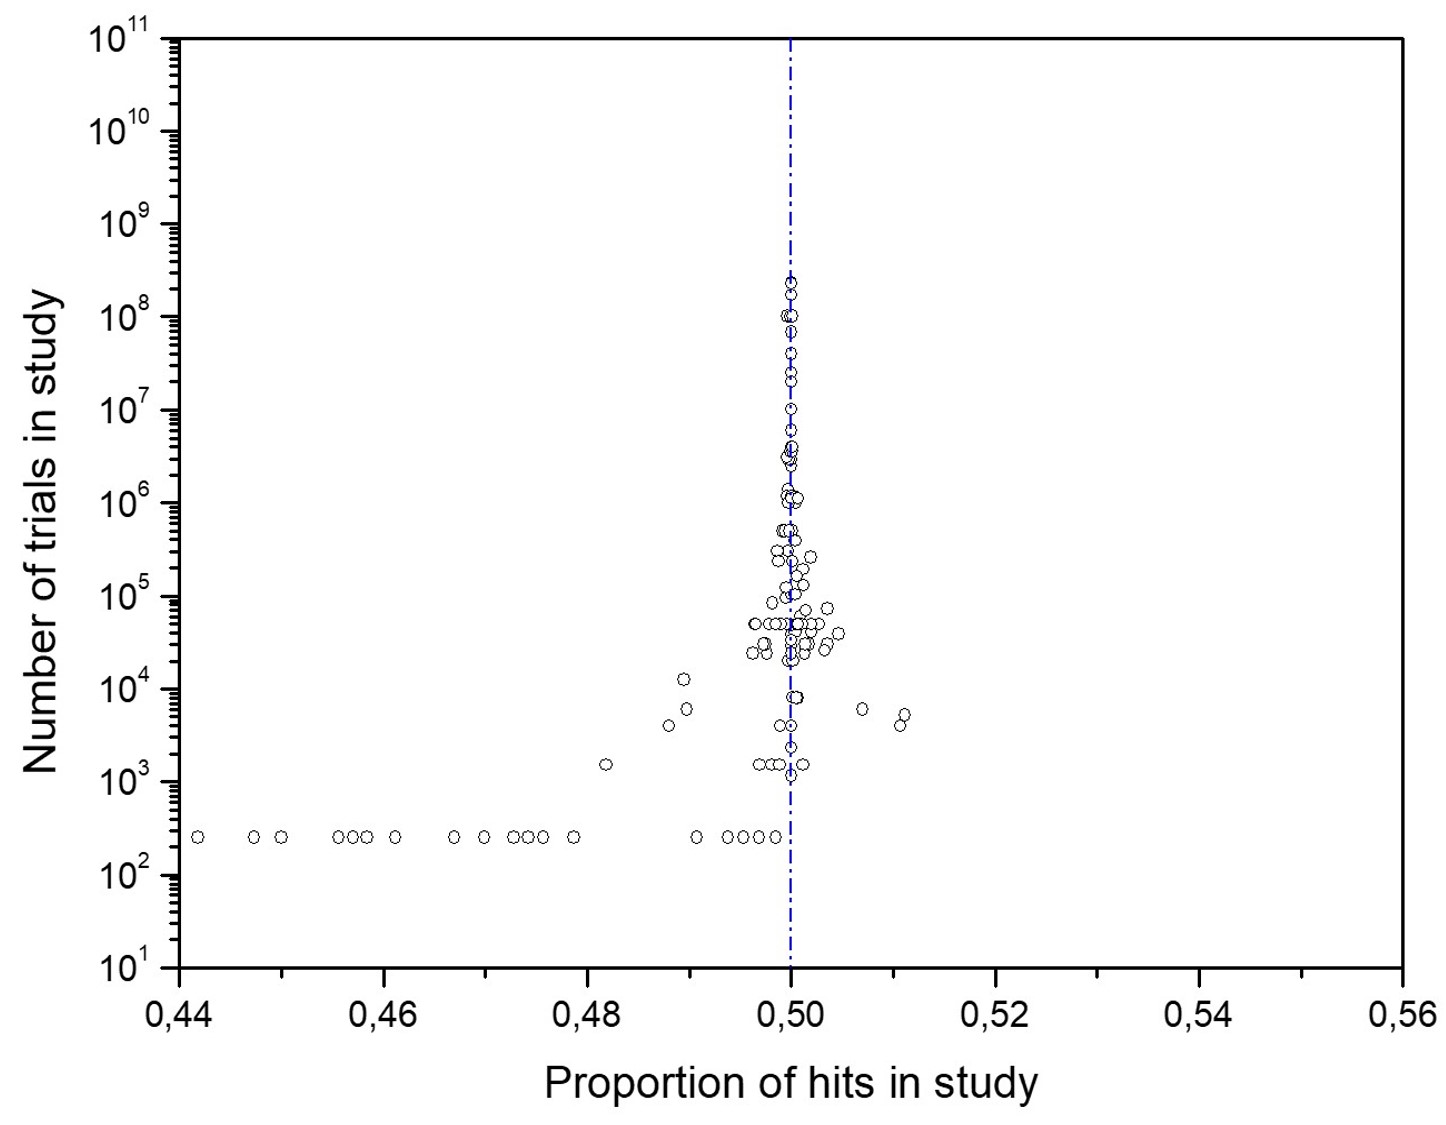
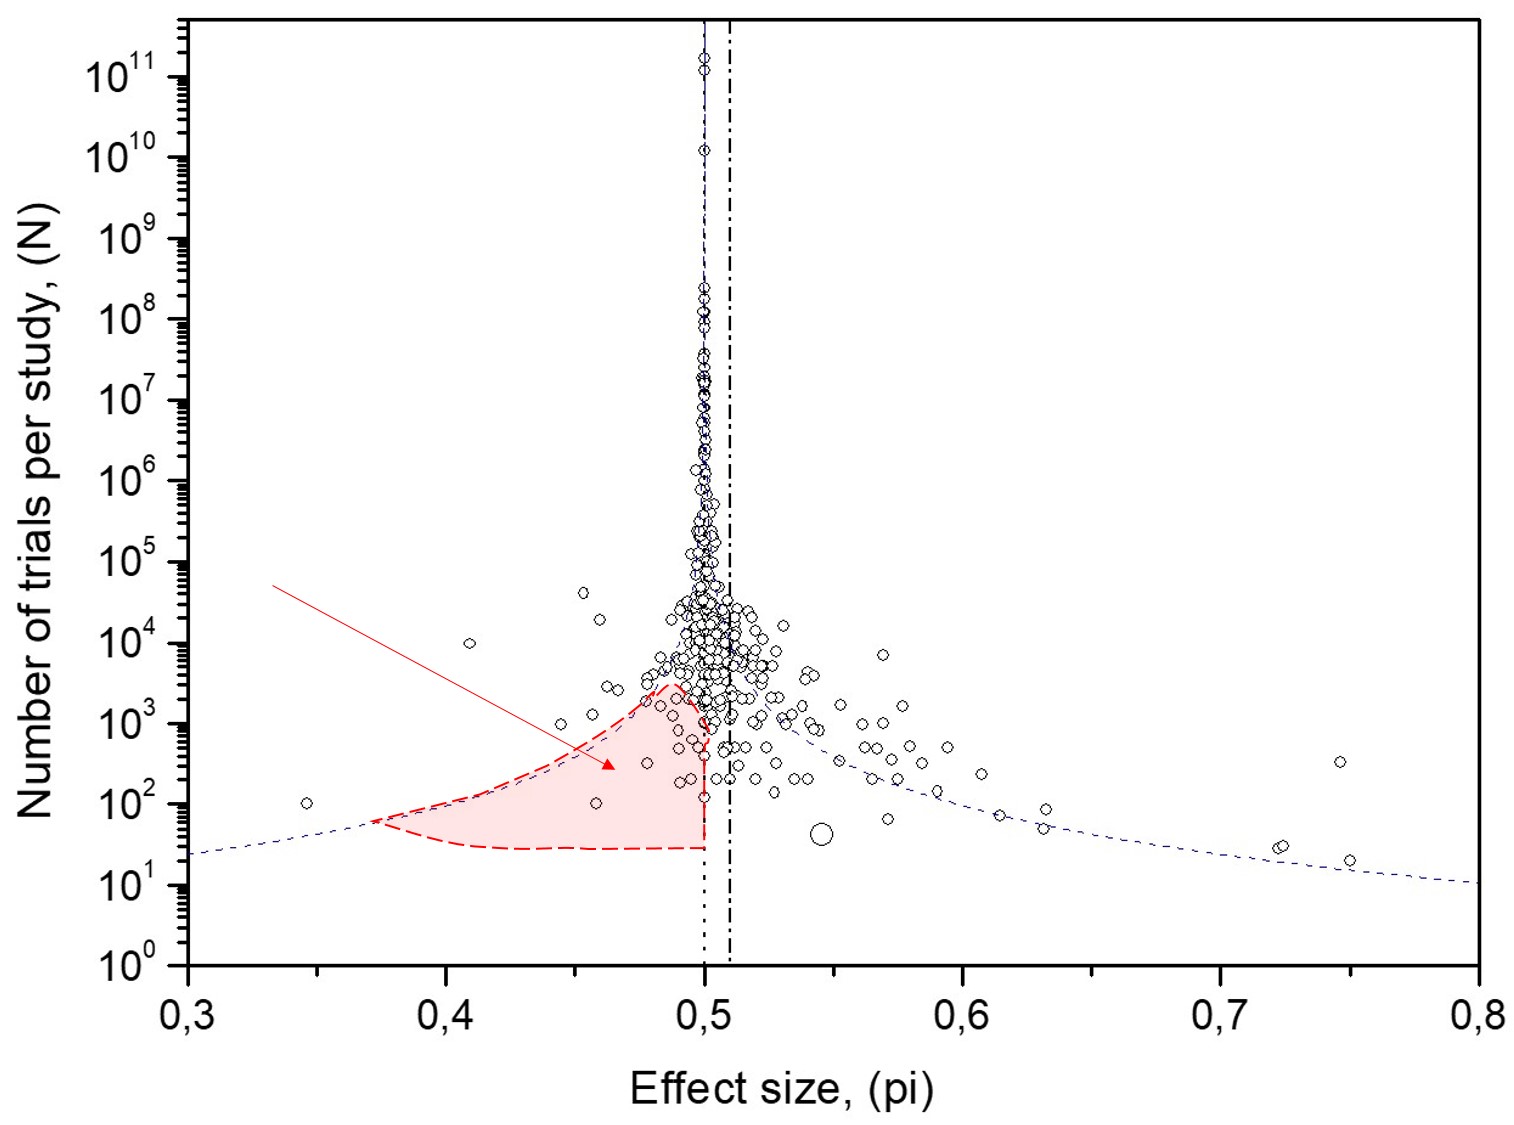
Figure 1 displays the results of 380 MicroPK tests conducted by 62 Principal Investigators over 35 years. The data comes from the BSB meta-analysis (BSB-MA) database. All tests aimed to explore the hypothesis that our thoughts may influence the outcome of random processes.
The phenomenon under investigation is psychokinesis (PK), specifically Micro-psychokinesis (MicroPK), which suggests that the mind can affect the probabilities of random processes occurring.
The funnel plot's Y-axis represents the number of trials or the experiment's size, N. The X-axis represents the proportion of hits in the study or the effect size, pi.
What about telekinesis?
The related hypothesis involves telekinesis, the ability to move solid objects through will and intention alone. A solid object consists of numerous atoms that jiggle randomly around their positions within their solid lattice driven by thermal energy. This movement creates a potential random process that the mind may influence mentally, suggesting a connection between the hypotheses of psychokinesis and telekinesis.
The task in the telekinesis scenario is quite challenging. The mind would need to simultaneously drive the alignment in the random motion of a vast number of atoms of the order 100.000.000.000.000.000.000.000 (Avogadro Number), moving the solid in the direction of will. The probability of success is extremely low, if not impossible.
What do the data points in Figures 1 and 2 represent?
If we toss a coin 100 times while wishing for heads to come up, and heads come up 55 times, then the proportion of hits in our experiment is 0.55. We represent this experimental MicroPK result on the funnel plot with coordinates Y = 100 and X = 0.55.
Out of curiosity, we toss the coin again 100 times without wishing for any side to come up, representing our control test. Suppose this time, heads come up 53 times, 53 hits, concerning the previous condition. Our control test results are Y = 100 and X = 0.53, which we can place on the corresponding graph in Figure 2. Each coin toss constitutes a trial.
We may choose a different random process, like rolling a fair die, where the probability of the desired outcome changes to one in six. The condition for recording hits in experimental or control trials remains the same. The likelihood of a hit or a miss can be estimated in this or any other random process and be represented on the same funnel plot (see equation 1).
Over time, electronic random processes replaced mechanical ones in MicroPK experiments. These advanced methods are faster and can collect more trials in less time.
Increasing the size of the study
Naturally, an experimenter may repeat the same two previous steps to collect more data. For example, they may run another 100 coin tosses while wishing for tails to come up and get 35 tails (hits) this time. The sum is two hundred MicroPK trials collected, N = 200. Next, come another 100 tosses without wishing for any binary outcome. In this follow-up control test, 45 tails, or 45 hits, come up concerning the previously set experimental condition. Altogether, N(exp) = 200 experimental trials with 55+35 = 90 hits and N(contr) = 200 control trials with 53+45=98 hits.
Suppose the intended experiment ended at these 200 trials for each condition. The researchers who will later perform the meta-analysis (MA) of similar studies such as this one will represent the result on the corresponding funnel plot of experimental MicroPK data by a point of coordinates Y(exp) = 200 & X(exp) = 0.45 (90/200). On the funnel plot of control data, the result appears at coordinates Y(contr) = 200 and X(contr) = 0.49 (98/200).
Some MicroPK tests may involve more than 200 trials. The BSB-MA consists of 380 experimental MicroPK tests, with the most extensive study comprising 10 billion trials, as shown in Figure 1.
We switch our will or intention 'on' and 'off' to collect random data assigned as experimental or control.
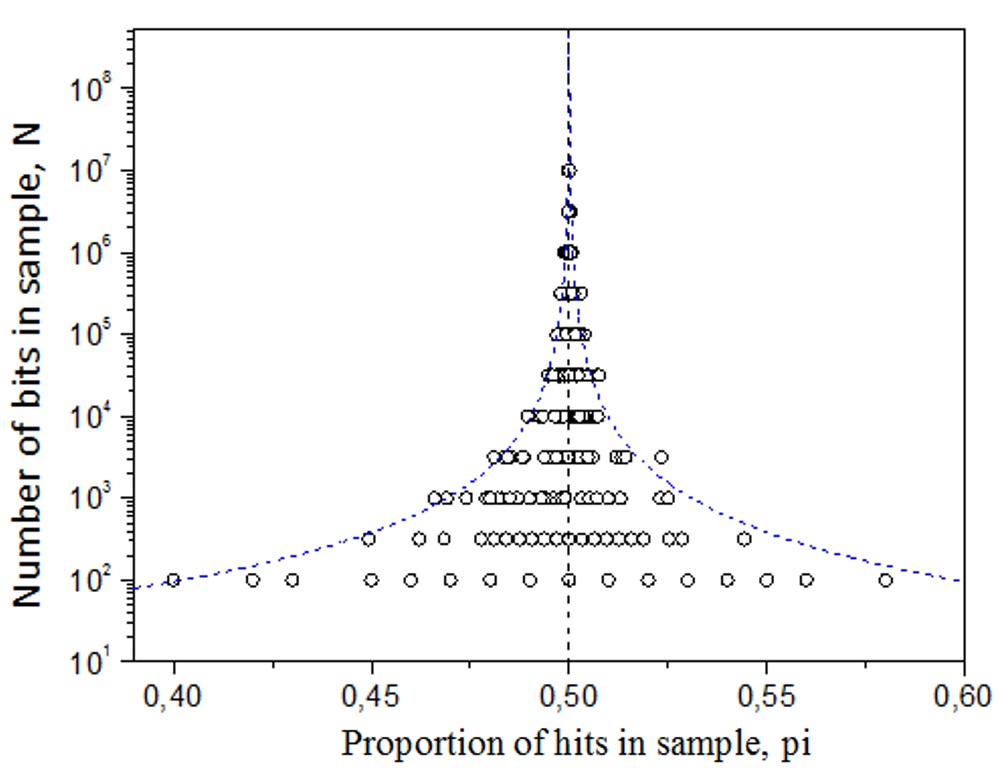
Not all experimenters who conducted MicroPK tests prioritized collecting control data. The BSB-MA database has 380 experimental MicroPK experiments, but contains only 137 control tests, as shown in Figure 2. The largest of the control data includes nearly 1 billion trials.
Where does the term "funnel plot" come from?
If the coin is fair or the process is random, we can expect an average of 50% hits. In smaller studies, the proportion of hits may vary significantly around this 50% mark. However, as the number of trials increases, the observed average of hits will converge towards the theoretical value of 50%, by the law of large numbers. See Figure 6 for illustration.
Figures 1 and 2 owe their shape, looking like an inverted funnel, to the law of large numbers. The average of hits scatters around 50% widely at its base in small studies, while their scatter decreases as the studies grow bigger. For this reason, they are called funnel plots.
What shape of the funnel plot would confirm the MicroPK hypothesis?
Placing a database on a funnel plot helps it assume a shape that can reveal valuable information about the process that generated the data.
If random events occur under the modulation of our wish throughout our tests, the proportion of hits prevails. The funnel plot of experiments where wish and intention influence the random process will converge to a proportion of hits higher than 50%. The funnel plot of such wish-modulated data will resemble that of computer-generated binary data of Figure 5.
What about the funnel plot of control data collected when nobody wished for anything about the random process's outcome? If the hypothetical MicroPK mechanism is not active, the funnel plot of control data will converge to 50%, while the data will scatter about 50%, as statistically expected in random processes. The funnel plot of such random data will resemble that of Figure 6.
We notice that computer-generated binary data, whether random or correlated, scatters symmetrically in funnel plots about their point of convergence.
Extracting information from the BSB-MA funnel plots
The funnel plot of control data
converges to 50%
Funnel plots of random data that converge to a 50% proportion of hits verify that the data came from random processes. The evidence perfectly aligns with the tested hypothesis for control data. No intention or external interference was employed to affect the data-generation process. All devices used to generate the 137 control tests, and consequently the MicroPK data, were indeed random.
All funnel plot data points represent independent efforts to investigate the same hypothesis employing the same random binary process of two possible outcomes, hit and miss.
The point of convergence, 50%, is the most representative effect size of the database collected over 35 years, showing a balance between successful and unsuccessful outcomes. The processes used were indeed random.
The funnel plot of experimental MicroPK data converges to 50%
The funnel plot of MicroPK experimental data also converges to a 50% proportion of hits, the most representative effect size of the database.
It confirms that no external agent modulated the random process outcomes even if the mind tried to interfere. Factors like the mind, wishes, intentions, psyche, or consciousness have not impacted the random process (see section What shape of the funnel plot confirms the MicroPK hypothesis? ).
The mind or consciousness does not influence any other physical system, such as the state of laser photons.
All funnel plot data points represent independent efforts to investigate the same hypothesis using the same binary random process, 'hit' against 'miss'. Can the mind push the probability of hits above 50%?
The funnel plot point of convergence, the most representative effect size, designates the entire database as one.
The scatter of funnel plot data
The convergence of the MicroPK data funnel plot to 50% effect size is evidence against the tested hypothesis, against the mind-over-matter effect.
The convergence point is not the only feature that provides valuable information regarding the nonexistent evidence of the psychokinesis hypothesis. The scatter of data around it is also significant, revealing the attitudes of MicroPK experimenters while collecting or reporting data.
We use the statistical confidence interval curves for random data to explore how the funnel plot data should scatter around the effect size of their point of convergence.
This approach is valid because the data originates from independent experiments and should be uncorrelated.
Each data point on the funnel plot reflects independent outcomes of the same random binary process, recording the proportion of hits in equivalent tests.
The statistical average of data
The point of convergence in a funnel plot of a sufficiently large database should coincide with the statistical average of all the data. This alignment occurs because the data is symmetrically distributed around that point of convergence, as illustrated in Figures 5 and 6.
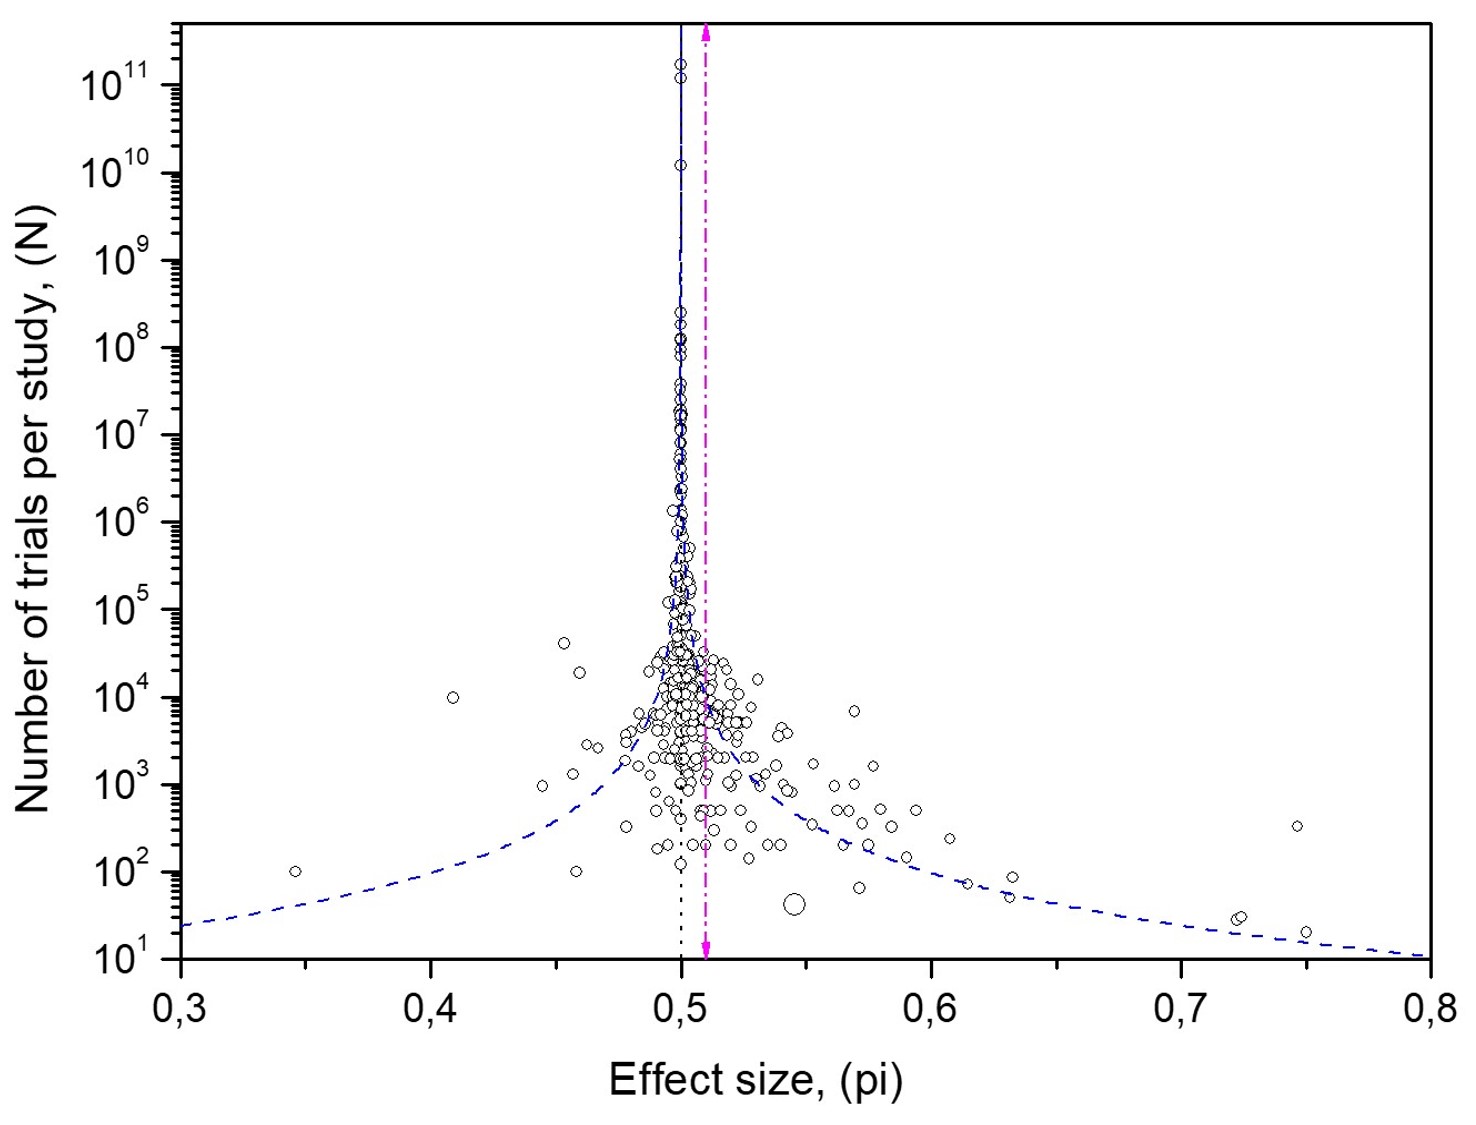
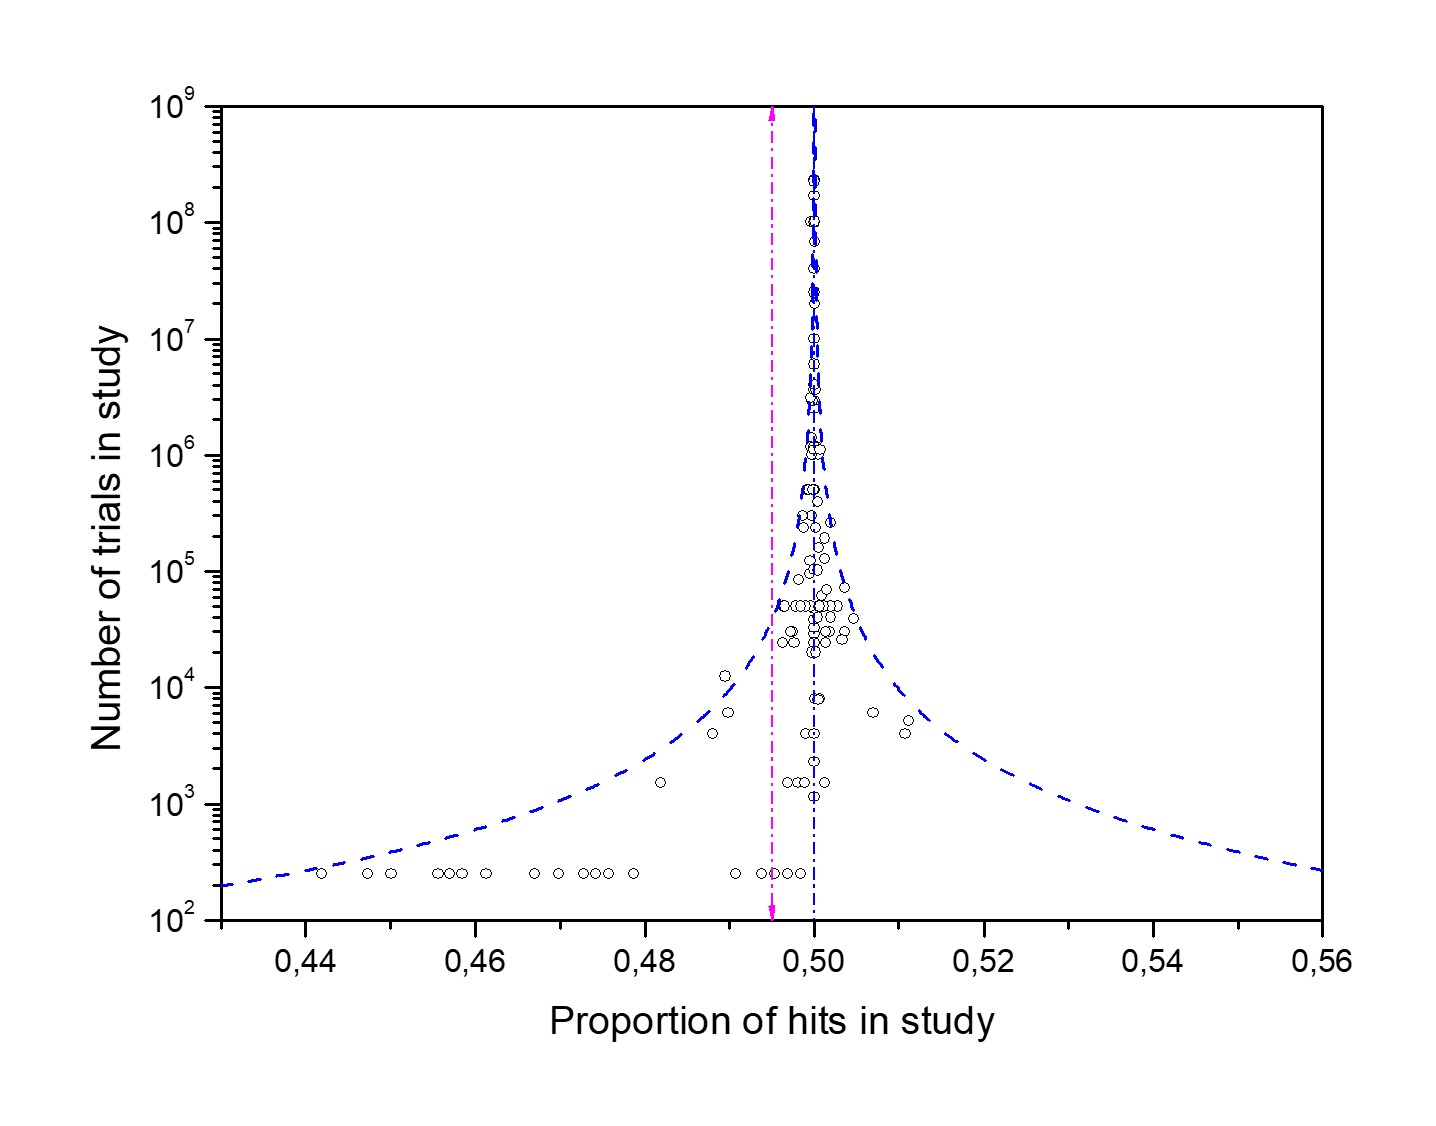
The observed asymmetry in the scatter of funnel plot MicroPK and control data around their convergence points (Figures 3 and 4) arises from experimenters' biases during data collection and reporting (see related section).
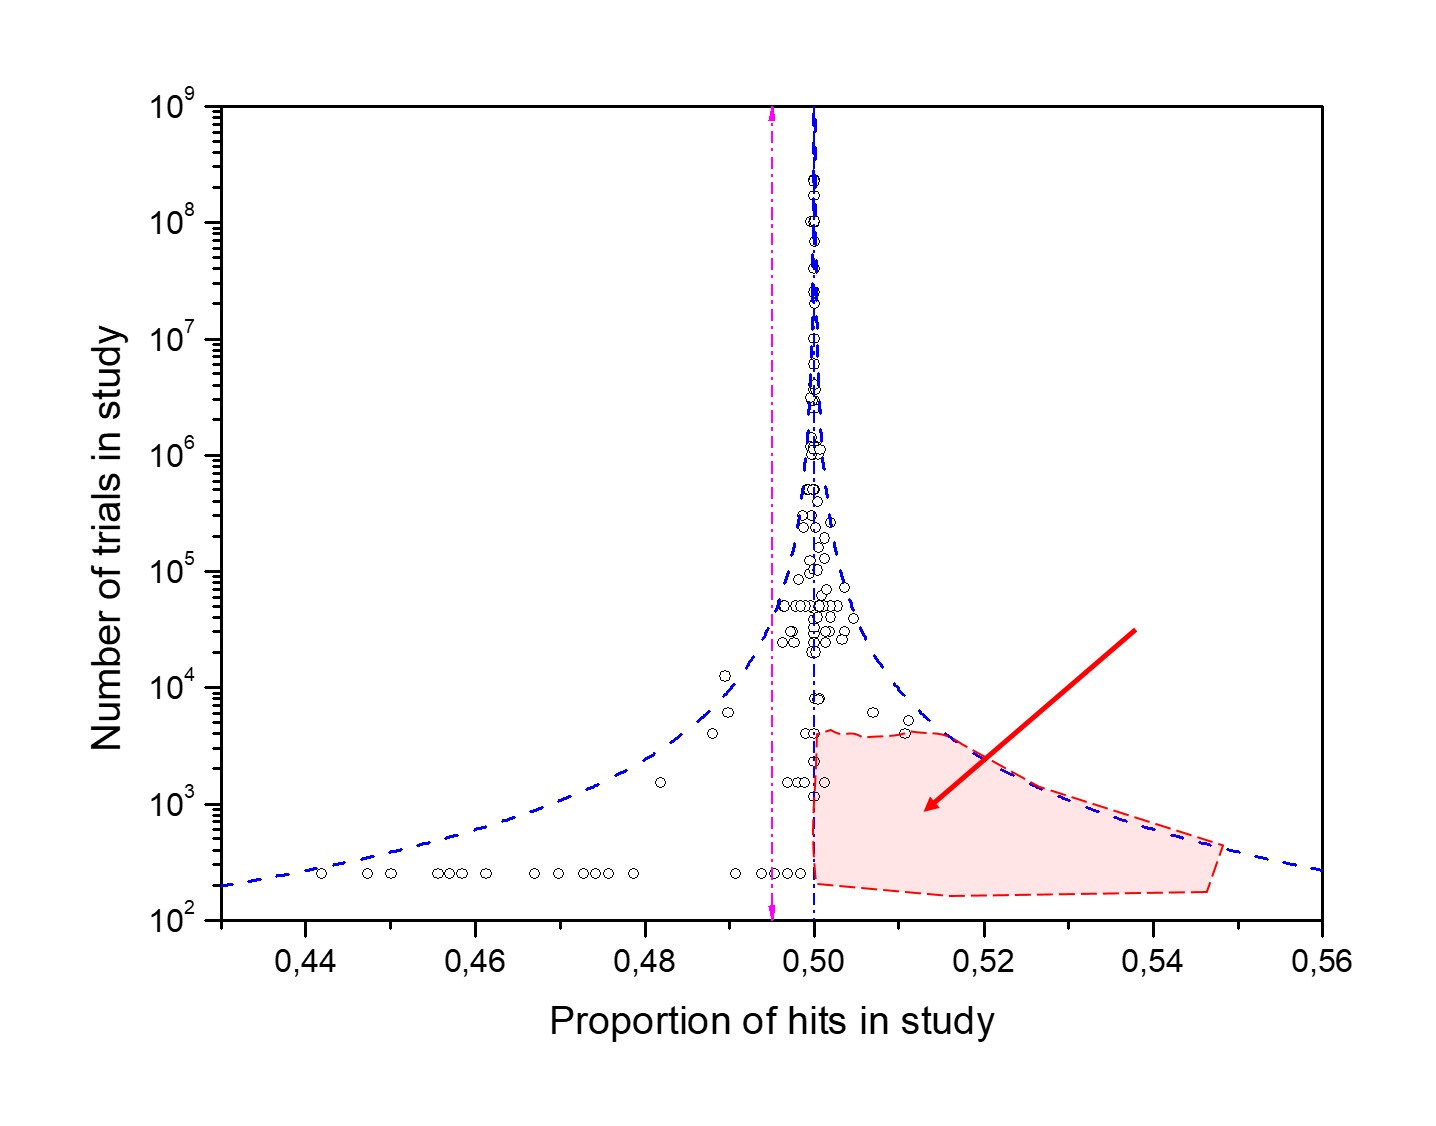
The statistical averages of MicroPK and control data are pi=0.510 with a standard error of 0.002 and pi=0.495 with a standard error of 0.001, respectively. They deviate from their points of convergence, which is pi=0.5. They occur about the point of convergence, pi=0.5, in opposite directions. Effect sizes below 0.5 in experimental MicroPK studies and above 0.5 in control MicroPK studies are considered not worth publishing.
The major cause of the data scatter asymmetry on the funnel plot is publication bias.
The confidence interval curves for random data
Thanks to statistics, we understand how random, independent, uncorrelated binary data should scatter around their convergence point in a funnel plot (see equation 1 in reference [1] and Fig. 12).
The blue dotted curves in Figures 3 to 6 represent the 95% confidence interval for random binary data. They should envelope 95% of the data on the funnel plot, provided the data is random and the database is sufficiently large.
BSB-MA experimental MicroPK data. In the funnel plot of MicroPK experimental data shown in Figures 3, 7, and 8, the curves don't meet their purpose, leaving out far more than 5% of the data. It indicates that binary experimental MicroPK scores are not uncorrelated as expected, as records of independent experiments. Statistics designed for random data cannot effectively describe them.
The BSB-MA control data. In Figure 4, the two 95% confidence interval curves do not adequately envelope the 95% of the 137 control data points. The section "Three types of biases contaminated the BSB-MA database" will discuss the possible reasons for this discrepancy.
Computer-generated random data. Figure 6 displays computer-generated random data, where the 95% confidence interval curves successfully enclose 95% of them.
-----------------------------------
[1] (2023) Understanding the Nature of Psychokinesis, Fotini Pallikari, (JAnom) Volume 23(1), pp. 103-131.
The confidence interval curves for nonrandom data
The model of Markov correlated data. The Markov model of correlated data describes the abnormally broader scatter of experimental MicroPK data across all sizes of studies (see equation 2 in reference [1]).
The Markov model is an extension of the statistics for the population proportion of successes in a sample of size N randomly drawn from a binomial population [2]. This extension of standard theory now applies to the case of correlated data [3].
The new statistic considers correlated draws at the trial level according to two self-transition probabilities: success (hit) following success (p11) and failure following failure (p00). It includes the case for random data with p11=p00=0.5.
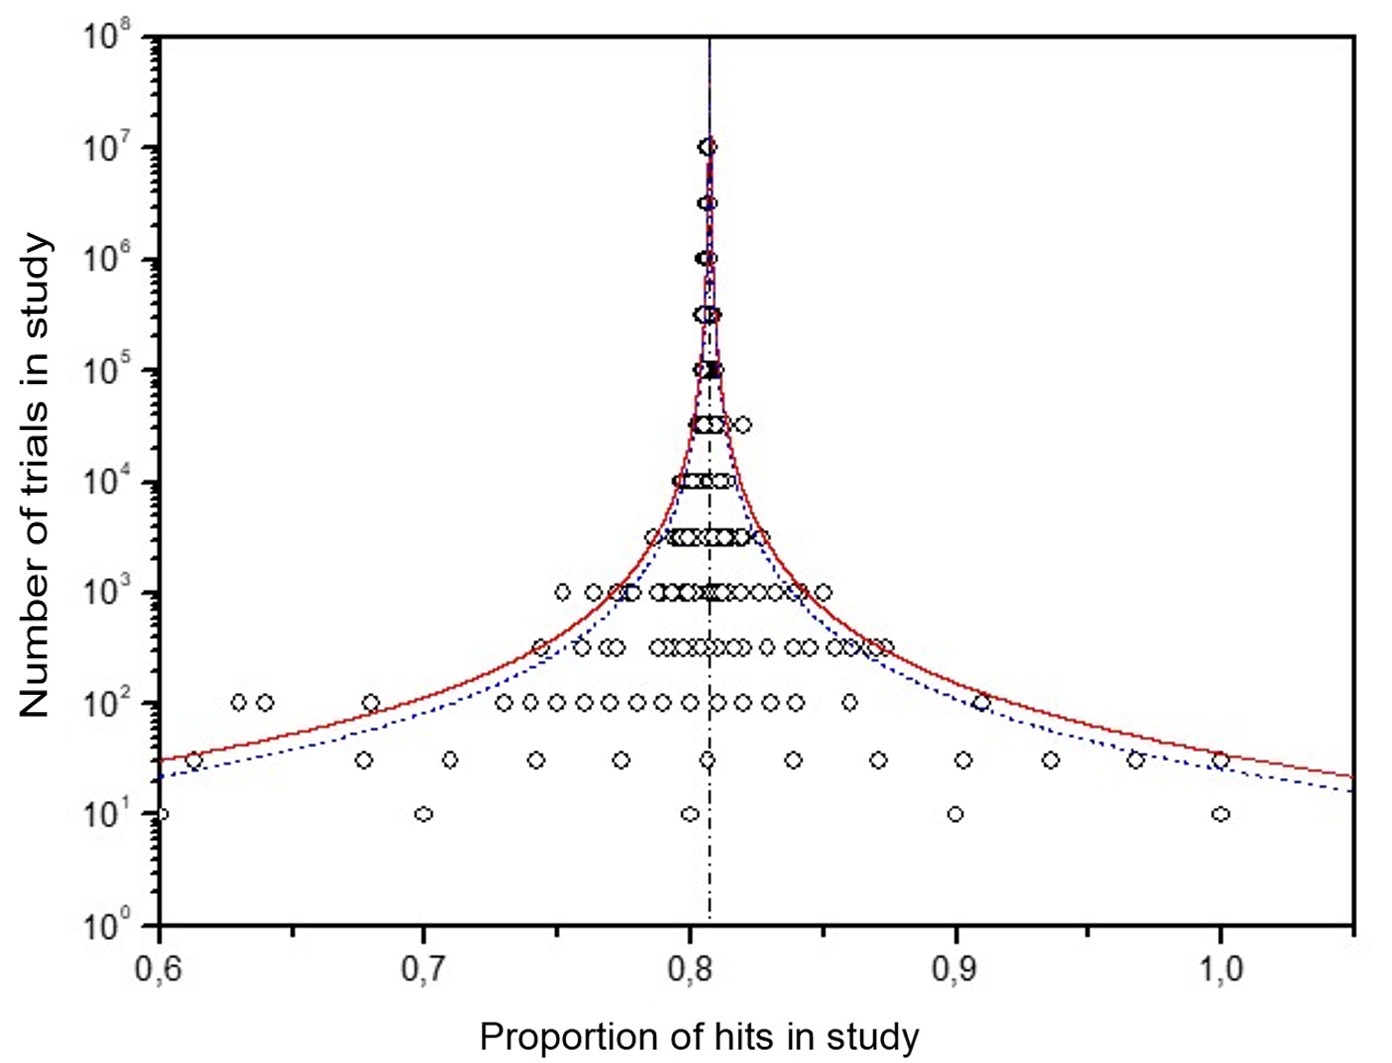
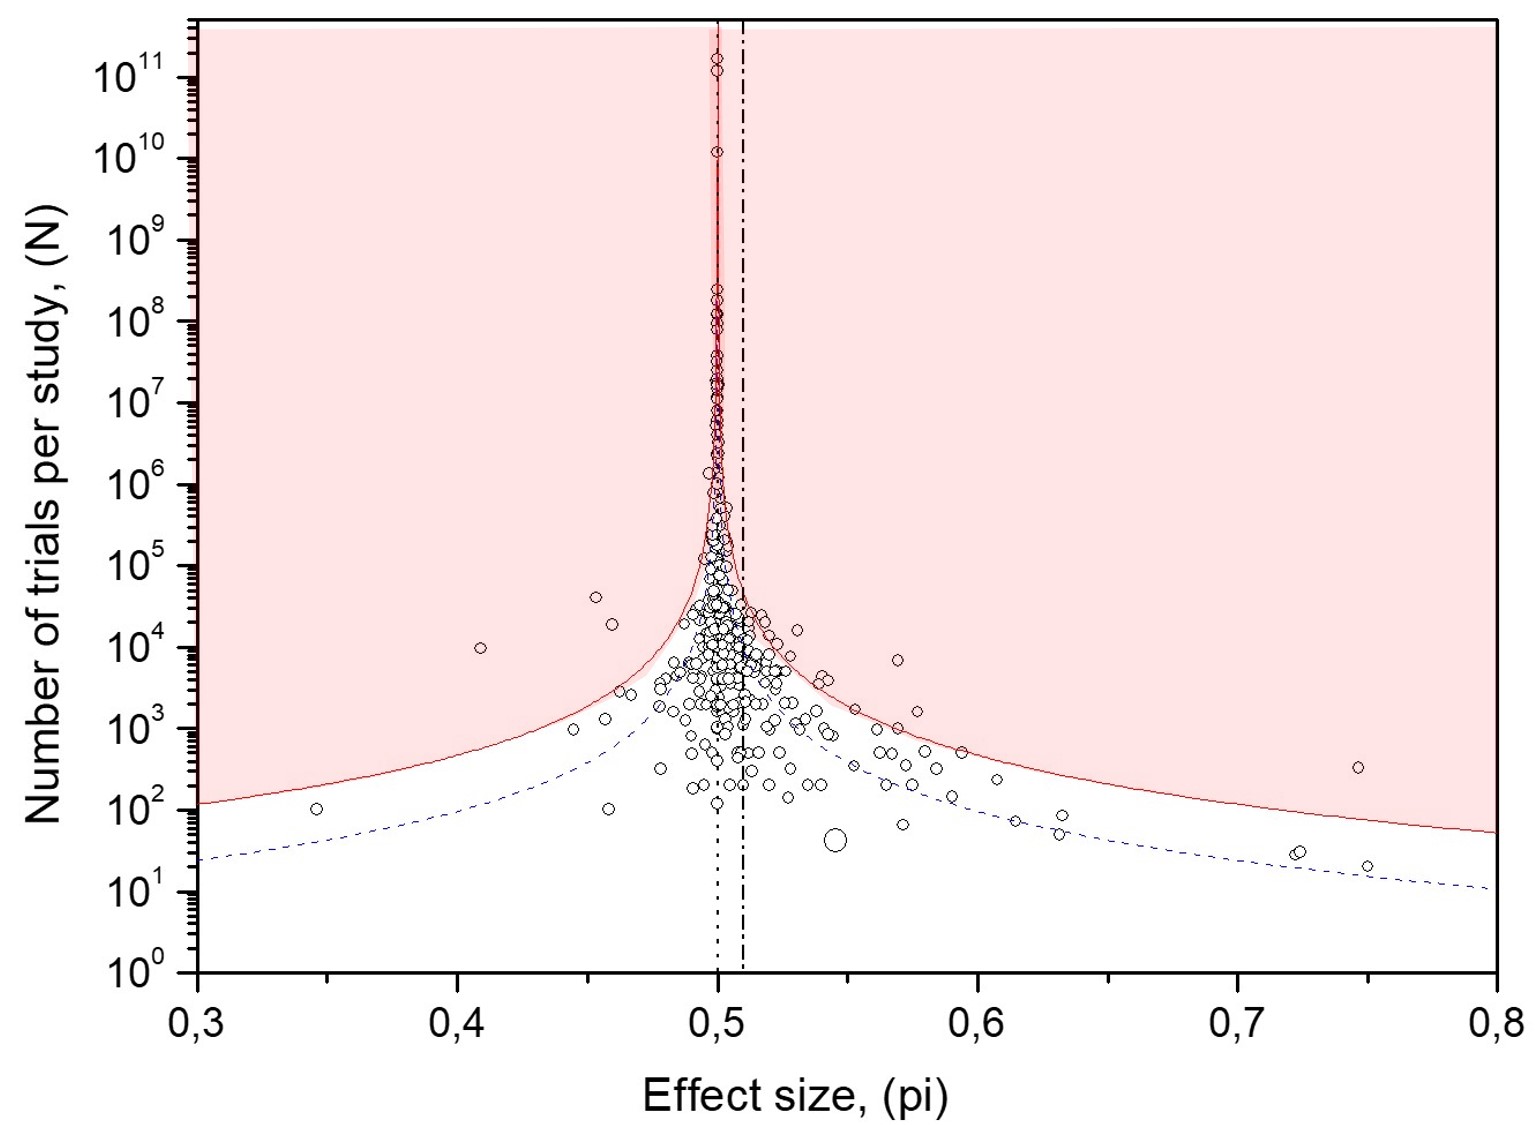
The confidence interval curves of correlated data, with p11 and p00 equal to 0.83, effectively envelope 95% of the MicroPK data as illustrated in Figures 8 and 12.
The Markov process provides a model of the effect on the database from all error-introducing biases by experimenters during data collection and reporting across experiments.
-----------------------------------
References
[1] (2023) Pallikari, F. Understanding the Nature of Psychokinesis. (JAnom) Volume 23(1), pp. 103-131.
[2] (1961) Spiegel, M. R. Theory and Problems of Statistics, page 158. (Schaum Publishing Co. New York).
[3] (1964) Von Mises, R. Mathematical theory of probability and statistics, pp. 217-223. (Academic Press, New York and London).
Three types of biases contaminated the BSB-MA database
1. Publication Bias, or the file-drawer effect. Experimenters (or journals) do not publish studies that do not support the investigated hypothesis.
2. The Experimenter Expectancy Effect Bias. Experimenters introduce (mainly) unintentional errors when collecting and reporting data to support their hypotheses.
3. The Conformity Bias. The experimenters introduce (mainly) unintentional errors when collecting and reporting data to conform with previously reported records, even if their result contradicts the investigated hypothesis.
Evidence of bias in the funnel plots of the BSB-MA database
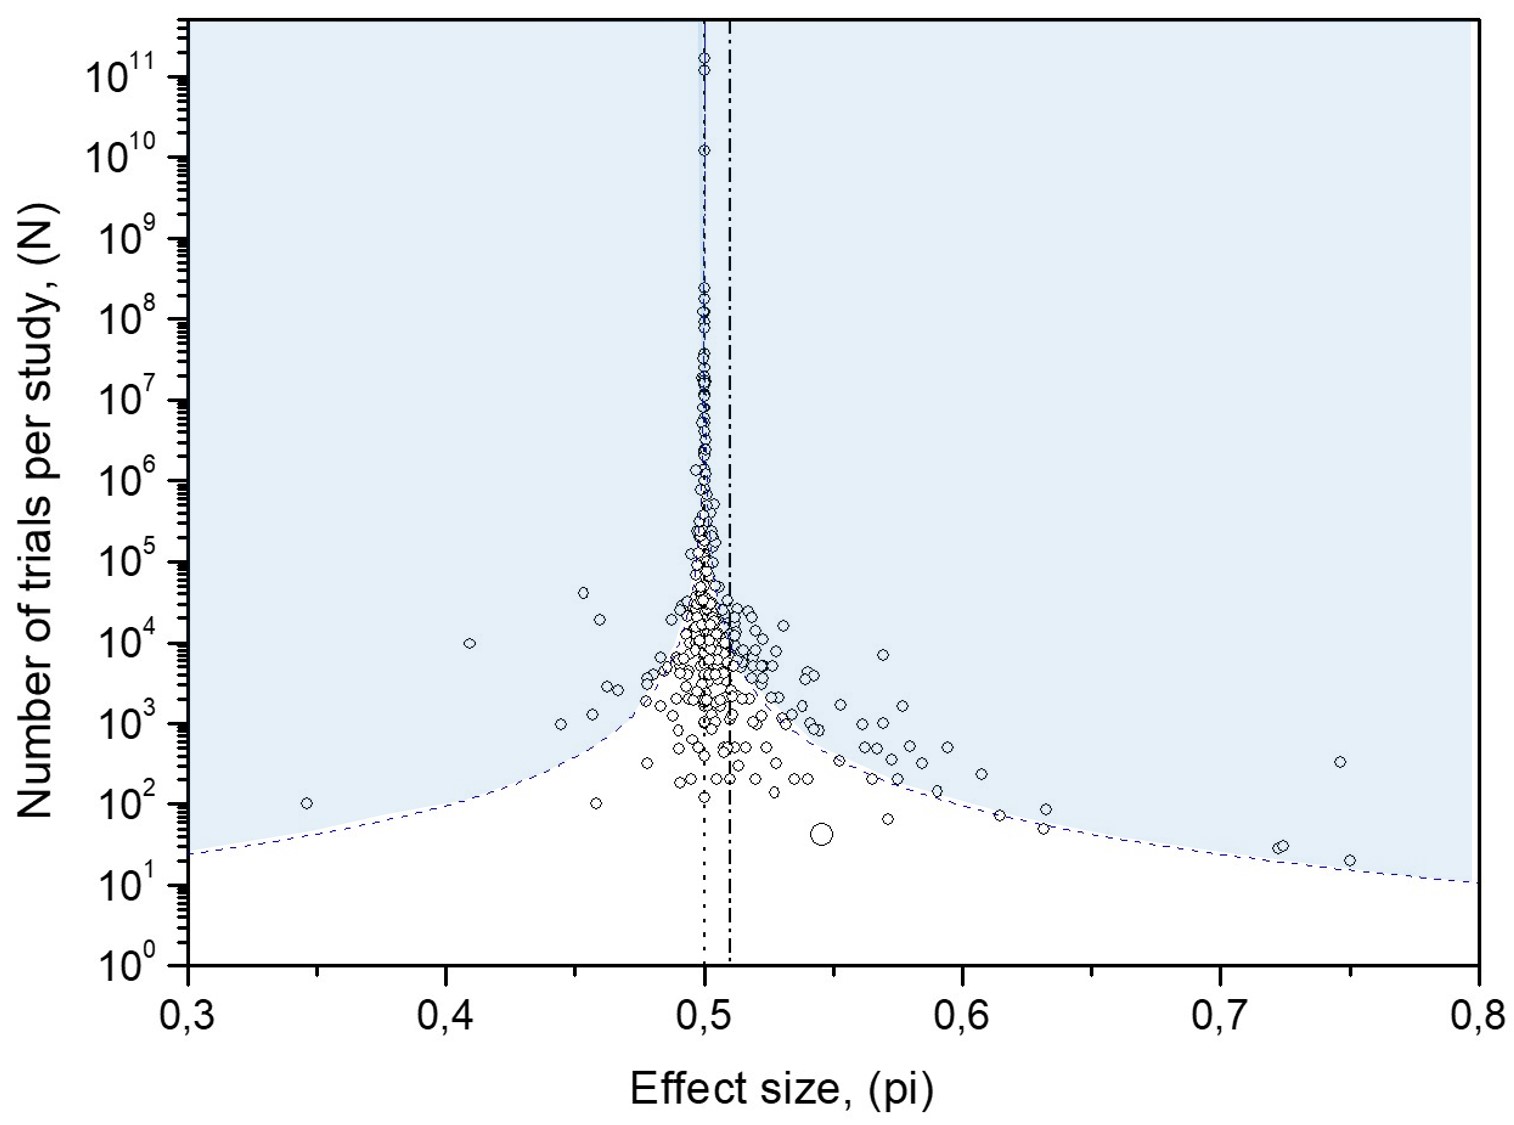
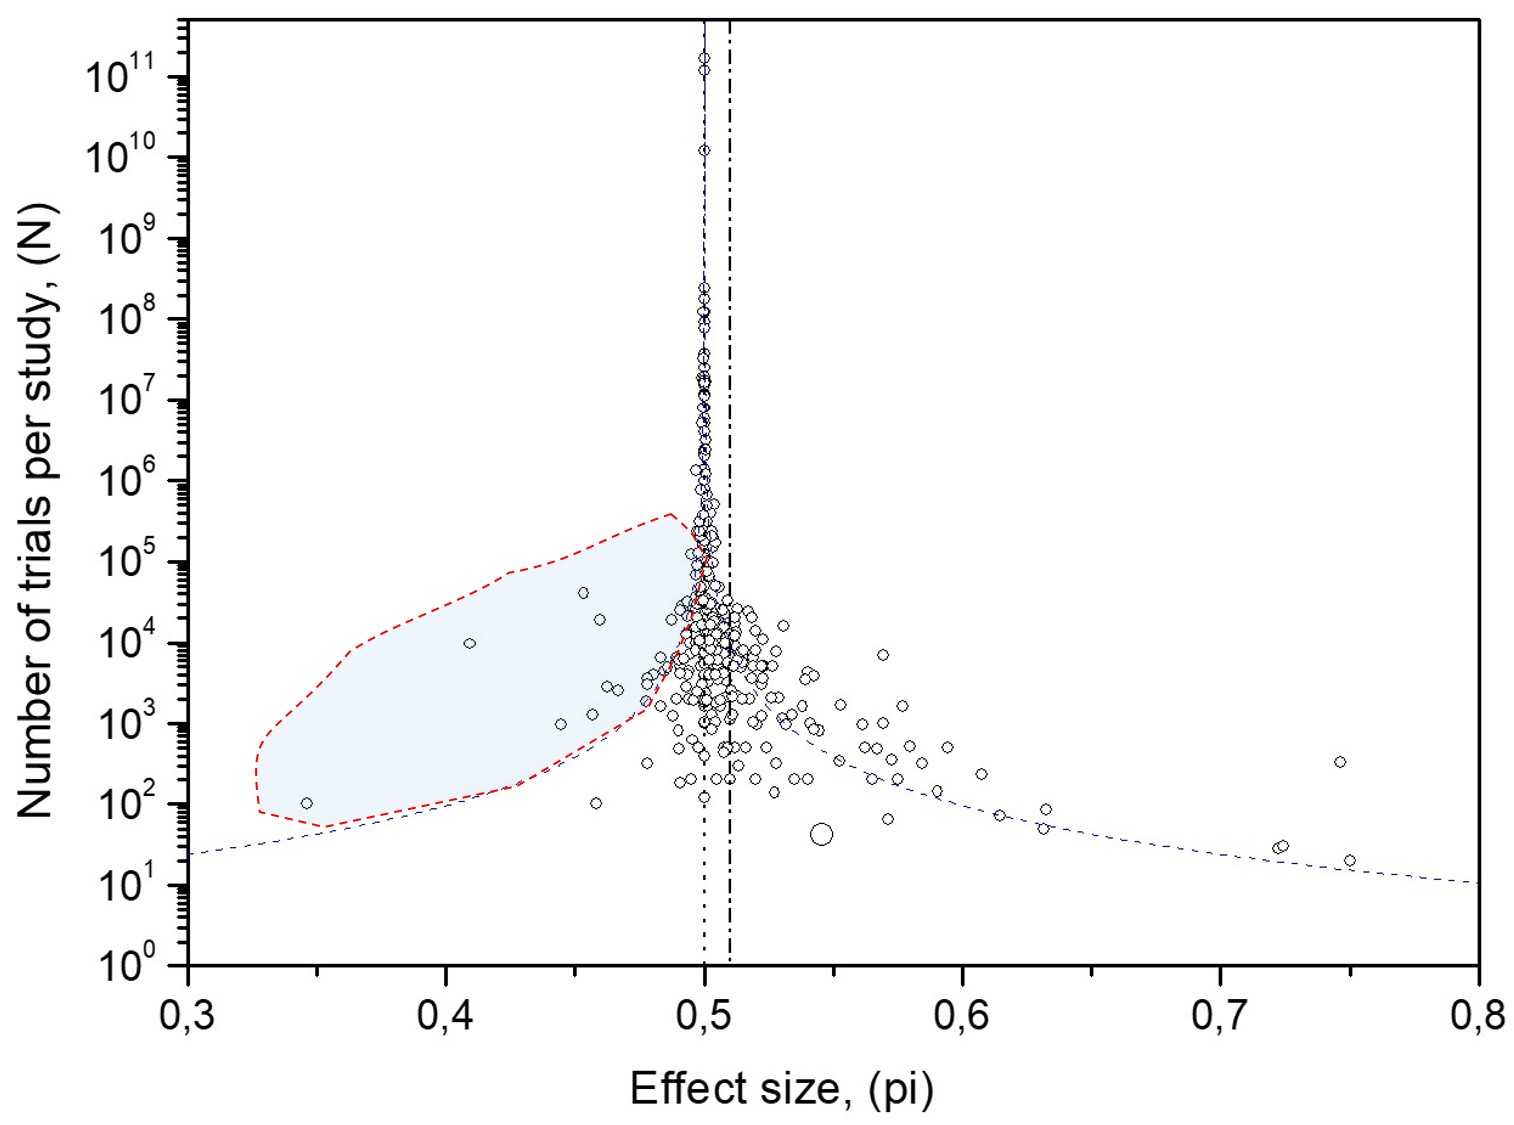
Effect 1: Overpopulation of the area beyond the 95% confidence interval curves for random data. The blue area in Figure 7 on the funnel plot for experimental MicroPK data is overpopulated. More than 5% of the 380 MicroPK data occupy that area.
Cause 1: Two types of biases: (A) The "experimenter expectancy effect" and (B) the "conformity bias."
----
Effect 2: The tight spread of the control data. This observation is the opposite of effect #1. The control data do not spread adequately beyond the 95% confidence interval curves clinging to them towards effect size 0.5, Fig. 4.
It illustrates an exaggerated effort to confirm the randomness of experimental devices, misinterpreting it as effect sizes close to 50%.
Cause 2: The "experimenter expectancy effect" bias.
----
Effect 3: Non-coincidence between data statistical average and point of convergence. The density of funnel plot data points about their convergence is asymmetrical, with added areas void of data:
(a) above 50% effect size in the control funnel plot, Fig. 10, (b) below 50% effect size in the MicroPK funnel plot, Fig. 9.
Cause 3: Two types of biases: (A) The "experimenter expectancy effect" introducing overpopulation and (B) "Publication bias" introducing underpopulation.
----
Effect 4: Overpopulation in the funnel plot area of MicroPK data appears on the far left-hand side. Extremely deviant effect sizes in this area beyond the 95% confidence interval curves for random data contradict the tested hypothesis, as shown in Fig. 11. This type of bias is not as significant a source of error contamination as the Experimenter Expectancy Effect bias.
Cause 4: "Conformity bias." Closely published MicroPK records appear correlated, indicating conformity in adjacently reported results. Shuffling the MicroPK time series destroys existing correlations by arrangement. (Fig. 13)
Unintentional errors
Unintentional errors. Errors are introduced unintentionally in data due to a lack of strict experimental protocols, triggered by biases. They are responsible for the excess data scatter from a 50% chance in studies with fewer than 100,000 trials.
In the MicroPK database, they risk being treated as small-size study effects discussed in medical analyses. All MicroPK analysis data, however, resulted from the same binary nonbiological random process running unaffected by study size (funnel plots converge to 50%).
Unintentional errors remain small in scale. As the study size grows larger than approximately 100,000 trials, some studies' small unintentional errors become diluted, allowing the MicroPK records to scatter about 50% as expected in random binary data (See pages 120-121 in Understanding the Nature of Psychokinesis).
False records are unidentifiable. False records are unidentifiable. Error-laden reports with scores falling at overpopulated areas of the MicroPK funnel plot are indistinguishable from correctly reported data produced by correctly functioning random processes. Furthermore, even records in nonquestionable regions may just as well be the product of error.
Is it possible to know exactly how some experimenters introduced errors?
NO
Consistent observation throughout the experiments is required to track how some experimenters introduced errors while collecting and publishing data.
![Fig. 12. The confidence interval curves for correlated binary (proportion of hits) data. They follow self-transition probabilities p11 and p00. The effect size to which the database converges is P=f(p11,p00). The variance factor, which determines if the data scatter will broaden or shrink compared to random data, is V=f(p11, p00). For equal self-transition probabilities, p11=p00=p, the database always converges to a 50% proportion of hits, while the square of the variance factor is [p/(1-p)]. The variance factor becomes 1 in random processes, p11=p00=0.5. The values of parameter Zo follow the statistics of random data. It is Zo=1.96 for the 95% confidence interval.](https://82840952b1.clvaw-cdnwnd.com/448d549c5aed8109384ccb84d1b9ed5e/200000245-1401a1401d/Markov%20statistics-7.jpeg?ph=82840952b1)

Figure 13. The time series were arranged chronologically by date of publication. Although this ordering is not perfect — for example, multiple results may appear in the same conference proceedings — it provides a reasonable approximation of the temporal sequence in which findings entered the literature.
When ordered in this way, both MicroPK and control datasets show persistent correlations (H above the baseline). After shuffling, the persistence disappears. This means the long-range correlation appears because studies were published one after another, with later results tending to resemble earlier ones, rather than behaving independently — a pattern consistent with conformity bias.
Conformity bias occurs when later studies tend to reproduce patterns already present in the literature. This can happen even when the result does not support the tested hypothesis.
It is also visible directly in the funnel plot (Fig. 11), where the far left-hand side shows a clear overrepresentation of studies beyond the 95% confidence boundary.
Together, these findings indicate structured dependence between studies rather than independent random variation.