

The double-slit diffraction experiment
Background
Several years ago, a series of experiments reported that focused human attention could distort the interference pattern produced by laser light passing through a double-slit. Subsequent publications reported further results obtained using the same experimental configuration as described in the original report.
Examination of the initial report showed that the stated experimental parameters could not be reconciled with measurable features of the published interference pattern and FFT power spectrum under standard double-slit diffraction theory. In particular, the reported geometry implied diffraction behavior incompatible with the figures presented. As a result, the reported setup could not represent a single physically coherent experiment. An initial review documenting these discrepancies was subsequently published.
In a later report, a different numerical value for the slit–camera distance was presented while the experimental configuration was described as unchanged. However, under standard diffraction relations, neither the original nor the revised slit–camera distance can be made consistent with the published figures and experimental parameters.
Taken together, the reported parameter sets across the successive publications cannot be made mutually consistent with one another or with the key reported evidence, namely the interference pattern and the FFT power spectrum, under standard double-slit diffraction theory. Even when revised parameter values are considered, the reported experimental description remains physically incompatible with the figures presented.
The Evidence
Extending the analysis, additional inconsistencies can be identified directly in the published FFT spectra. These concern a systematic offset of the frequency axis that is central to how the double-slit diffraction data are evaluated (Figure 6).
In the published FFT graph, the spectrum does not start at zero frequency. Instead, a visible one-unit gap appears at the origin of the frequency axis, consistent with a uniform displacement of the spectrum along that axis. An offset of this kind is not expected from diffraction physics or from the reported experimental geometry. It is, however, compatible with an artefact arising during numerical FFT processing.
This frequency offset directly and measurably affects the key spectral ratio R (Fig. 6), a central quantity in the reported spectral analysis.
In Detail
The key measure R is defined as the ratio of two spectral powers (see Figs. 4 and 5). The denominator, P(1), represents the spectral power at a frequency of one unit and remains constant throughout the experiment, reflecting the steady laser intensity through the two slits. The numerator, P(K), by contrast, represents the main spectral peak and should vary only if the interference pattern (the contrast, or visibility, of fringes) is altered.
In theory, a genuine decrease in R would require a reduction in the main spectral peak power. However, R can also decrease if the FFT spectrum is uniformly shifted along the frequency axis. In the very low-frequency region, such a shift raises P(1) because of the local spectral shape, while the peak power remains unchanged at its displaced position. As a result, a shift of less than one frequency unit (within the 0–1 interval) is sufficient to reproduce the reported reduction in R without any physical change in the interference pattern.
For a one-unit shift, as illustrated in the example of Fig. 6, the resulting reduction in R reaches approximately 71%.
My analysis of a large MicroPK database found no evidence that intention alters physical outcomes or their underlying probabilities. Instead, the structure of the data was consistent with experimenter-introduced biases capable of producing a weak statistical effect in the absence of any genuine physical influence. This background is relevant here because the double-slit hypothesis likewise attributes a physical change in an optical signal to directed attention. In the present double-slit case, however, the central issues are not solely statistical: key features of the published evidence—most notably the systematic spectral offset and internal inconsistencies among reported parameters—are not readily explained by ordinary experimental imprecision under the reported conditions within the stated experimental framework.
Integrity Conditions for Reliable Double-Slit Diffraction Evidence
For double-slit diffraction data to support quantitative inference, certain non-negotiable integrity conditions must be satisfied. Failure to meet these conditions undermines the interpretability of reported interference patterns and derived spectral measures, independently of any subsequent analysis.
A. Sensor response integrity. The camera sensor must respond uniformly across its active area. Non-uniform sensitivity, particularly near sensor boundaries, distorts fringe visibility and alters the spatial frequency content extracted from the recorded pattern.
B. Parameter verifiability. All reported experimental parameters, wavelength, slit separation, slit width, pixel size, and slit–camera distance, must be independently verifiable through direct measurement or reliable documentation. Accurate parameter reporting is essential for assessing consistency between stated settings and observed diffraction features.
C. Geometric consistency. The slit–camera distance must be compatible with the detector dimensions so that the central diffraction band is neither truncated by the camera window nor reduced to a disproportionately small fraction of it . If the band is much narrower than the sensor, fewer fringes are sampled, reducing the accuracy of fringe-spacing and frequency estimates; if wider, information is lost. Only geometries satisfying this condition permit reliable FFT-based evaluation.
D. Alignment consistency. The optical axis, slit orientation, and detector alignment must produce a symmetric interference pattern centered on the sensor. Misalignment deforms the interference pattern (centering, symmetry, truncation).
E. Sampling plausibility. Reported pixel dimensions must be physically plausible and consistent with the camera model used; otherwise, the experimental geometry is ill-defined, and all subsequent spatial and spectral interpretations become unreliable.
Application to the reported experiment
In the reported double-slit experiment, the stated slit–camera distance is incompatible with the fringe spacing and FFT peak position shown in the published figures under standard diffraction relations. As a result, the reported geometry and the observed diffraction features cannot describe a single physically coherent setup. In addition, the fringe visibility estimated from the interference pattern agrees with the visibility inferred from
the reinstated FFT spectrum, but not with that inferred from
the reported FFT spectrum, indicating an internal inconsistency confined to the published spectral representation.
Reporting incorrect experimental results
A. Spectral representation. The reported FFT spectrum exhibits a one-unit frequency offset that cannot be accounted for by the physical properties of the stated optical configuration. Such an offset alters the value of the spectral ratio used to support the reported effect, thereby undermining the evidential interpretation drawn from the spectrum.
B. Experimental description. The reported diffraction geometry and associated parameters are internally inconsistent with the published figures and with basic alignment requirements for reliable double-slit measurements. These inconsistencies compromise the validity of the reported results.
C. Reporting implications. When key reported parameters, figures, and derived measures cannot be made mutually consistent under standard physical constraints, the reported evidence is not sufficient to support the stated hypothesis. In such circumstances, the results should be presented with explicit qualification, including the unresolved internal inconsistencies, to meet accepted standards of transparent scientific reporting.
As Richard Feynman* famously stated:

This principle represents a fundamental standard of scientific practice and provides a general benchmark for evaluating how experimental results are reported and interpreted, particularly when claims challenge established physical theory.
*Richard P. Feynman. The Character of Physical Law (Penguin Books Ltd, Middlesex, England, 1992, p. 148).
Illustrating Consistency Constraints in a Double-Slit Diffraction Experiment
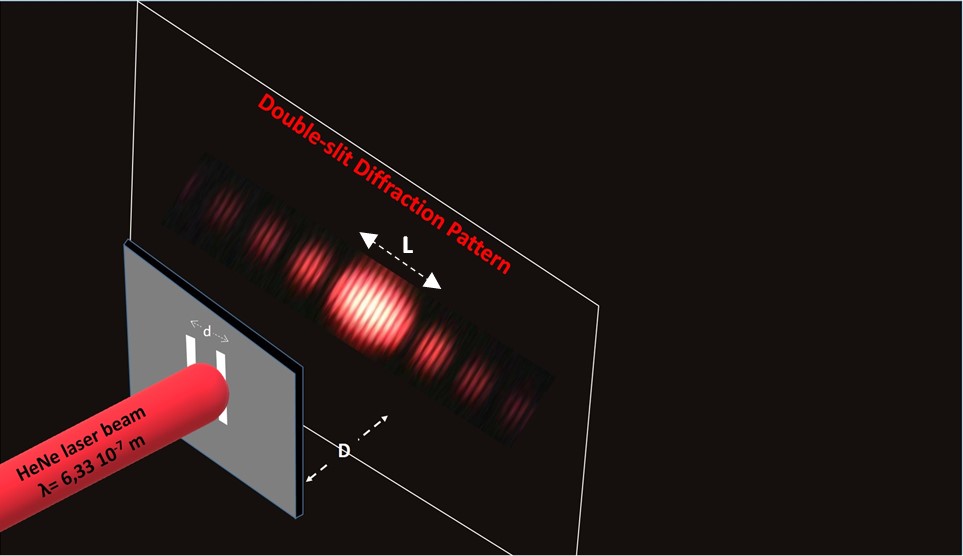
Figure 1. A schematic representation of the double-slit diffraction experiment. The double slit diffracts the HeNe laser beam of wavelength λ=632.8 nm passing through it. Each slit has width (a). The separation of the two slits is (d). The diffracted light pattern, an array of dark and bright regions with fringes within the latter, is projected on a screen (or a camera window) at a distance (D) from the double-slit.
The brighter central area with fringes is the central diffraction band of width (L). The number of fringes N in the central diffraction band depends on the ratio d/a. If d/a = 20 then N = 39:

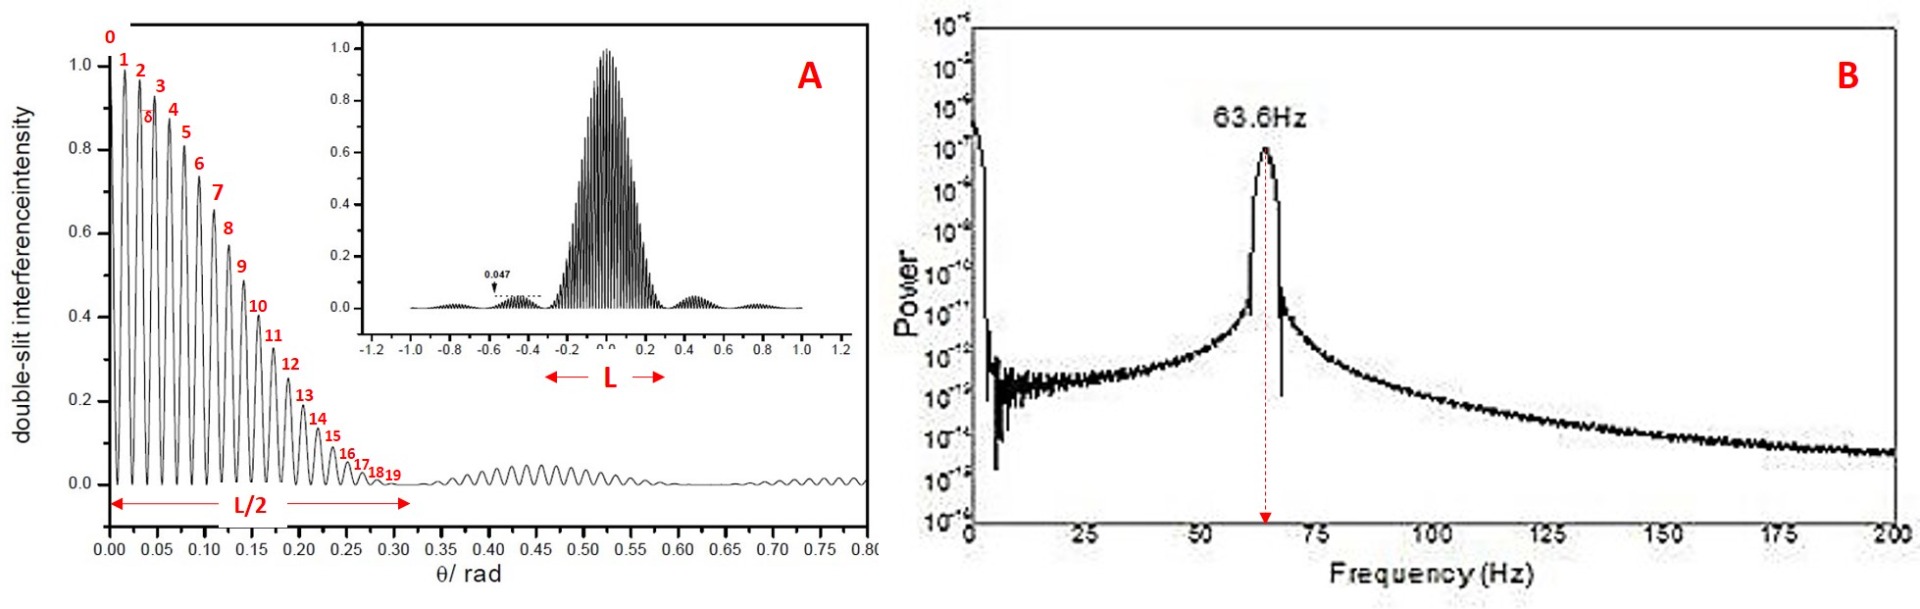
Figure 2. (A). Example of a computer-simulated double-slit diffraction pattern with a characteristic ratio of d/a=20, as explained in Fig. 1. It displays the light intensity variation across the pattern. The magnified half of the central diffraction band is on the left. Each fringe is numbered. Fringe #20 is missing in agreement with theory. The inset shows the full double-slit diffraction pattern.
Inferring geometric constraints from reported figures.
A double-slit experiment that produces a central diffraction band allows for a sufficiently accurate estimation of the fringe spacing, δ (see Fig. 2A). Even without direct access to the experimental setup, a scholar can determine the distance D between the slits and the screen (or camera) by substituting the estimated δ—along with its uncertainty—and the known experimental parameters λ (wavelength) and d (slit separation) into the standard diffraction relation:

In the current example, which is a computer simulation of the published experiment, the spacing between fringes is approximately 0.0157 radians (in angular units).
(B) The Fast Fourier Transform (FFT) spectrum of the simulated double-slit diffraction pattern. The Y-axis of the spectrum Fig. 2B, represents the power associated with periodic components in the diffracted light. The X-axis corresponds to their spatial frequencies.
The prominent spectral peak at 63.6 Hz arises from the periodic structure of the interference pattern, determined by the fringe spacing δ produced by diffraction and interference through the two slits.
The frequency, F(K), of the main spectral peak is the inverse of the fringe spacing
δ:


Figure 3. Table of the Fast Fourier Transform (FFT) frequencies and their corresponding powers. (Pallikari, 2012*). The Fast Fourier Transform (FFT) applied to the diffraction pattern from a double-slit experiment yields distinct spectral components. Each frequency corresponds to a physical feature of the diffraction and interference pattern captured by the camera. The key frequency components are interpreted as follows
P(0). The spectral power at zero frequency, P(0), represents the total light intensity recorded by the camera. It corresponds to the DC component of the FFT and reflects the overall brightness of the diffraction pattern.
P(1). The spectral power at one frequency unit, P(1), corresponds to the light intensity I(0) passing through the two slits, where I(0) = I₁ + I₂. It relates to the broad modulation envelope of period L across the central diffraction band, produced by single-slit diffraction. Since the optical setup remains fixed, P(1) remains constant during the experiment: P(1) = constant.
P(K). The main peak power P(K), at frequency F(K), arises from the periodic fringe structure of spacing δ within the central diffraction band. It reflects the fringe visibility (V)—the contrast between bright and dark interference fringes due to two-slit interference.
The ratio of spectral powers P(K) to P(1), referred to as the measure (R) (see Figure 4), equals the square of the fringe visibility: R = V².

Objective of the Experiment
The double-slit experiment was designed to test whether human intention can reduce the spatial coherence of light, as indicated by a decrease in the spectral ratio R = P(K)/P(1). In related terminology, it tests the often termed "Mind–Matter Interaction hypothesis."
The Reasoning
The intended inference is as follows: if focused attention were to reduce the spatial coherence of the diffracted light, the fringe visibility V would decrease, leading to a decrease in the spectral peak power P(K). Under the working assumption that the reference power P(1) remains constant across conditions, the ratio R=P(K)/P(1) would likewise decrease.
Accordingly, the experiment tests the mind–matter interaction hypothesis by examining whether R shows a systematic reduction during intervals of focused mental attention.
(*) On the question of wavefunction collapse in a double-slit diffraction experiment, Fotini Pallikari. (2012). arXiv:1210.0432 [quant-ph], https://arxiv.org/ftp/arxiv/papers/1210/1210.0432.pdf).
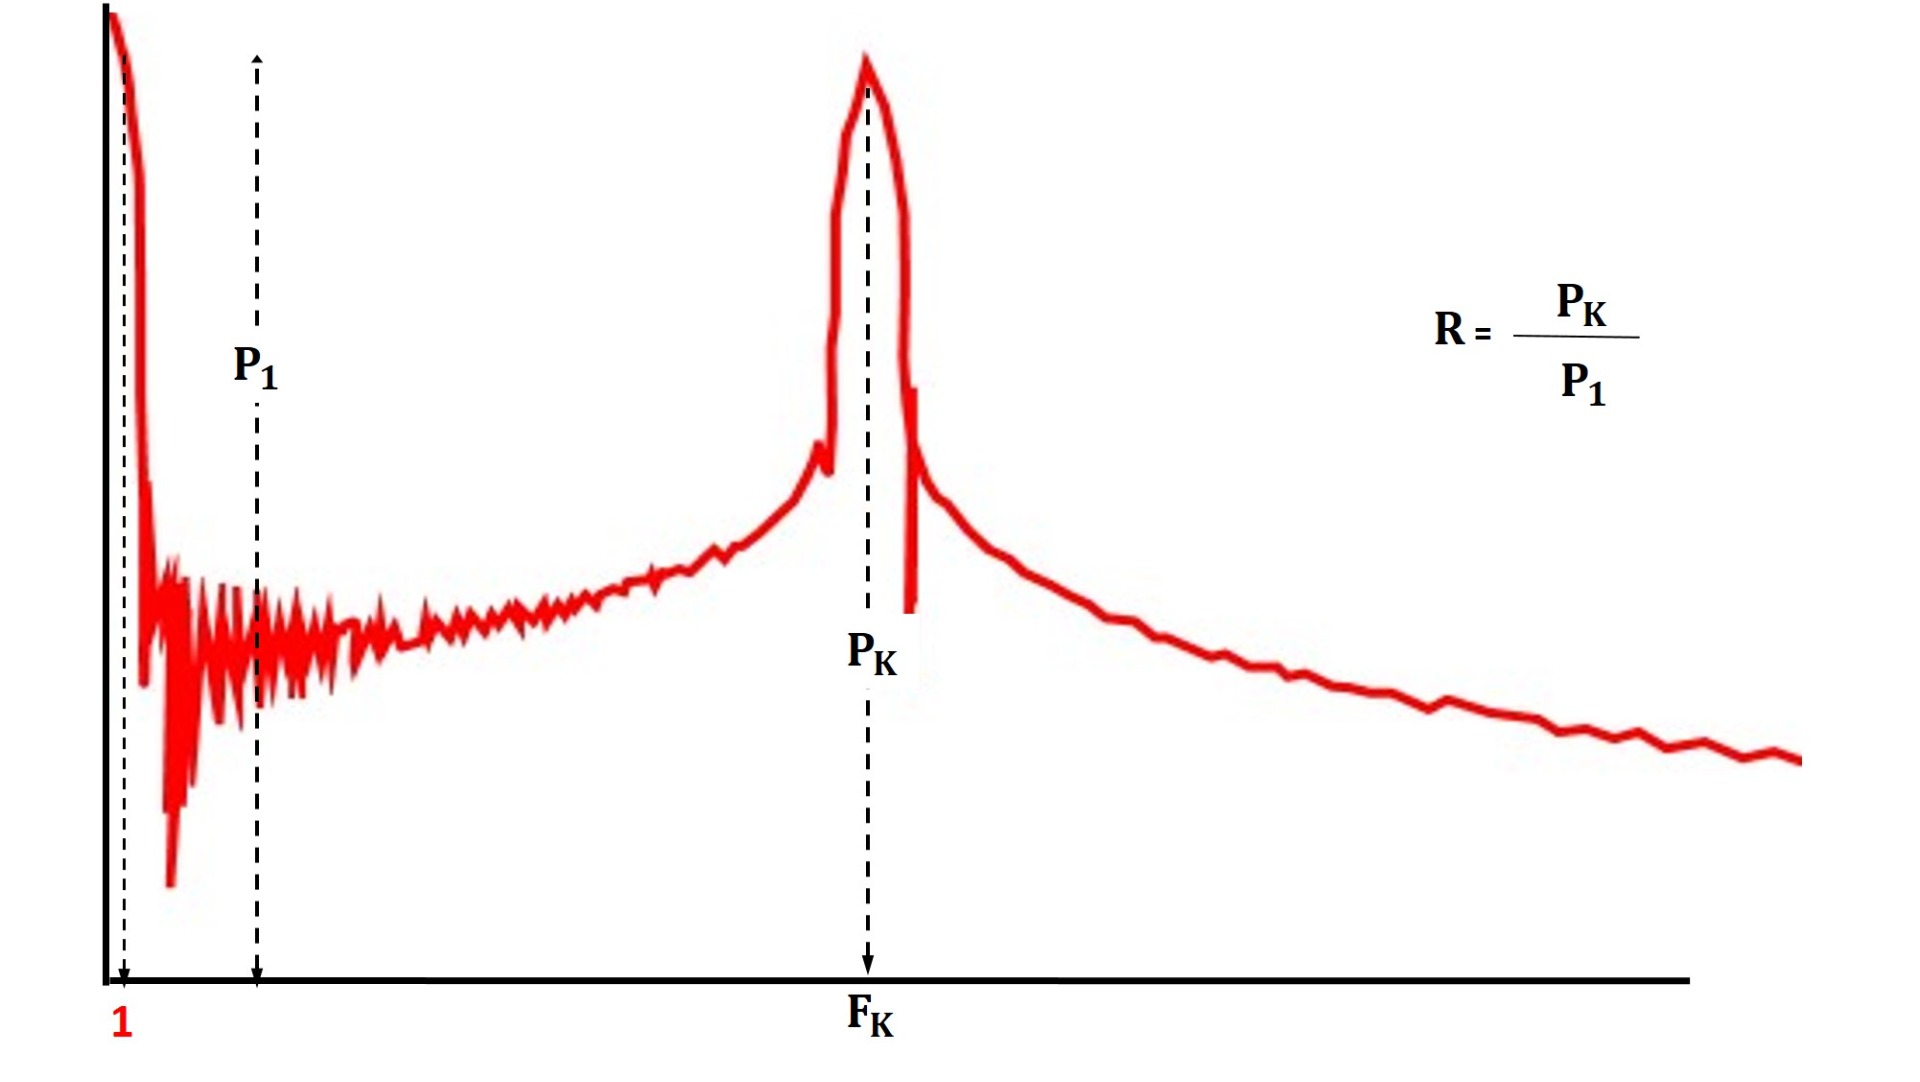
FIGURE 4. The Fast Fourier Transform (FFT) spectrum of the double-slit Diffraction Pattern showing the spectral powers P(1) and P(K).

FIGURE 5. Observing evidence for Mind-Matter Interaction on the FFT spectrum.
If the mind interferes with the (spatial) coherence of diffracted laser light, the peak power decreases from P(K) (red curve) to P'(K) (blue curve).
As P(1) in the denominator of (R) does not change, a possible mental interference will cause the key measure (R) to decrease, a situation often termed, somewhat inaccurately, as 'collapse of photon wavefunction'.
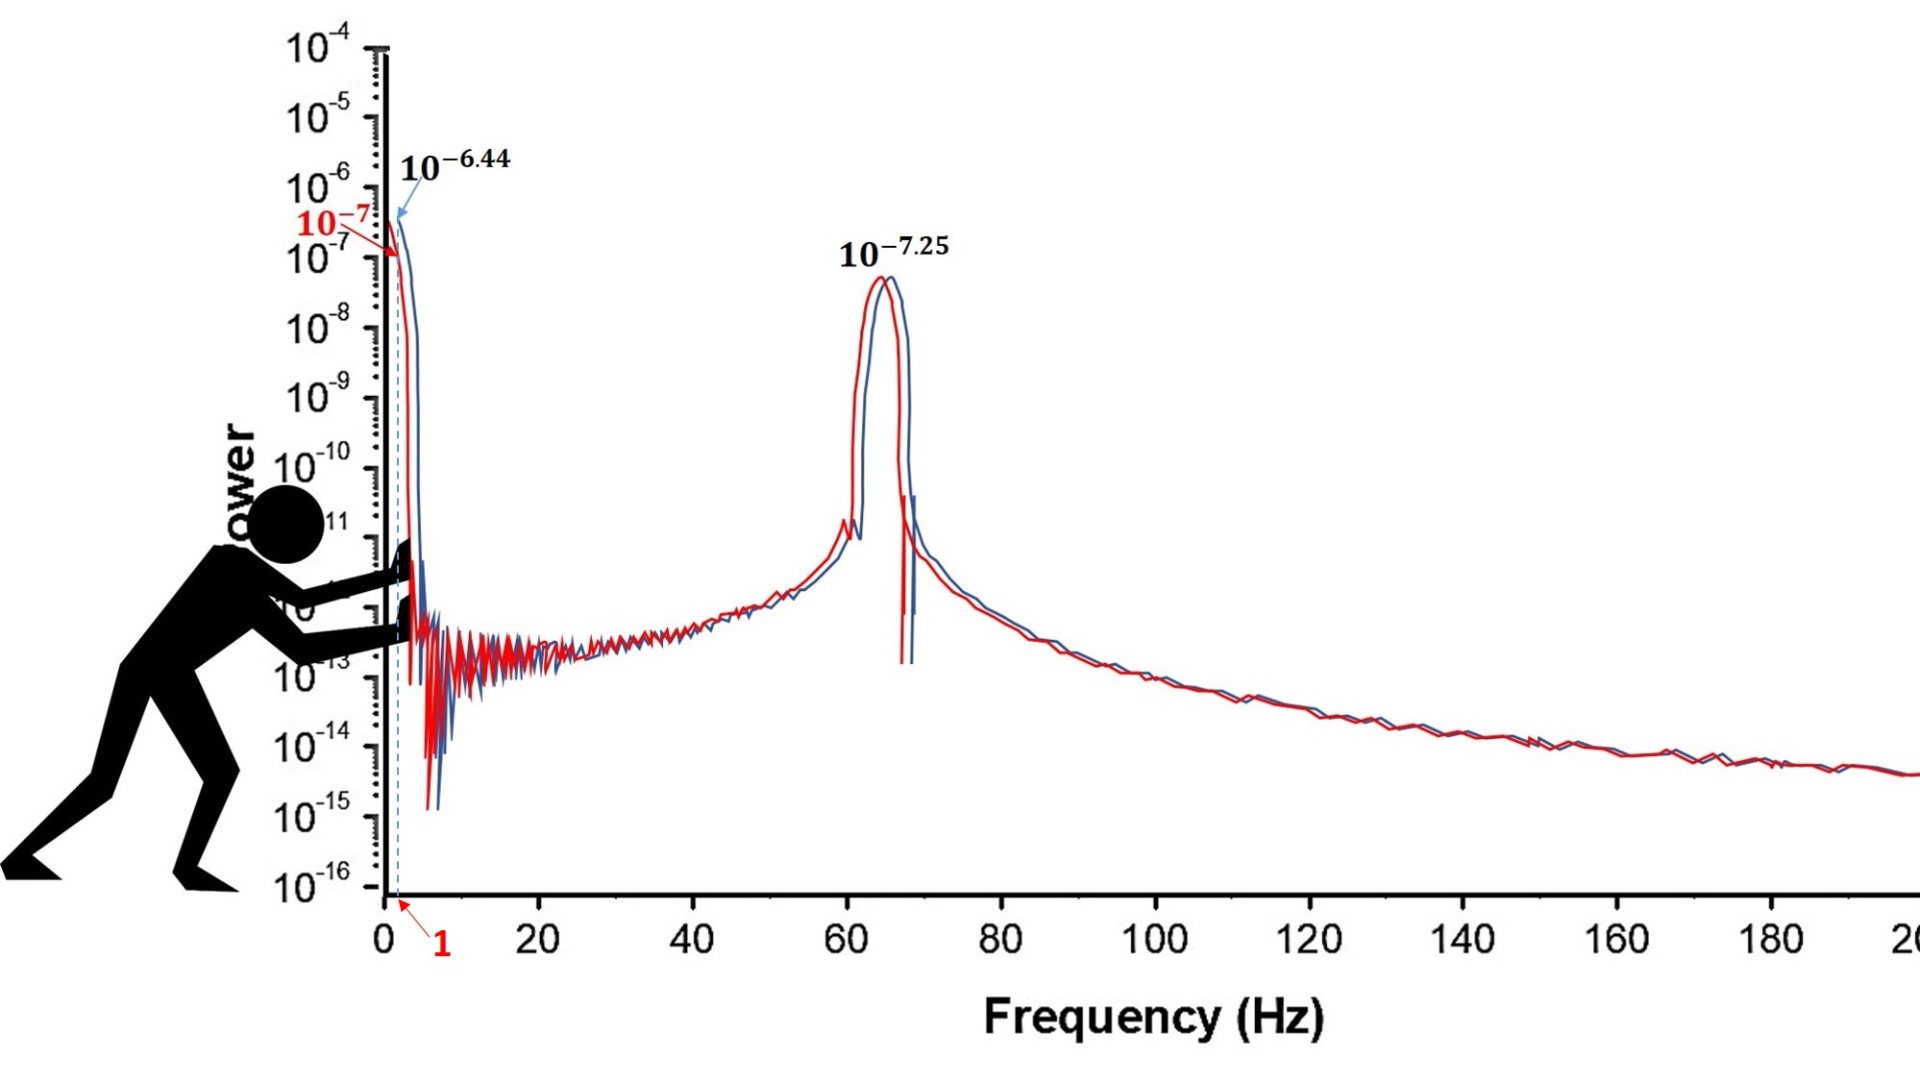
FIGURE 6. Illustration of how a frequency-axis offset artefact alters the spectral ratio R=P(K)/P(1), without any physical change in the interference pattern.
In the current example, the spectral peak at its proper position (red curve) is at a frequency F(K) = 63.6 Hz. Its spectral power, P(K), is ten to the power of -7.25. The power at one unit of frequency P(1) is ten to the power of -7. The key measure (R) is then 0.56, as the ratio of the two powers P(K) and P(1):

Let us shift this FFT spectrum to the right by a tiny amount of one unit of frequency. The peak at its new position has frequency (K') increased by one unit, becoming 64.6 Hz (blue curve). The peak power, P(K'), will be the same as before the shift, ten to the power of -7.25.
Due to the steepness of the spectrum at low frequencies, the spectral shift will force the power at one unit of frequency to increase. It is now ten to the power of -6.44. The shift will affect the key measure, which becomes (R') = 0.16.

The tiny spectral shift forced the key measure (R) to decrease from 0.56 to 0.16, causing it to drop by 71%.

A one-unit spectral shift introduces the maximum possible artificial reduction in the key measure R—in this example, a 71% decrease, determined by the specific shape of the FFT spectrum.
Any smaller shift between 0 and 1 frequency units will produce a smaller reduction in R.
Most importantly:
Even a partial frequency-axis offset can reduce R substantially, reproducing the reported decrease without any corresponding physical change in the interference pattern.
Sensitivity of Spectral Measures to Frequency-Axis Offsets (Illustrative Analysis)
Figures A–C illustrate how small frequency-axis offsets in an FFT spectrum affect derived spectral measures used in the double-slit diffraction analysis cited above. These graphs are based on illustrative fits to reported spectral shapes and are intended to demonstrate sensitivity, not to reconstruct the reported experiment.
Graph (A). Logarithmic Increase in P₁ with Frequency Shift: It shows that the logarithm of the spectral power at one frequency unit, P(1), increases approximately linearly with a frequency displacement Δf over the range 0≤Δf≤1, Eq (1). This behavior follows directly from the steep low-frequency slope of the FFT spectrum in this frequency region. See also graph E (inset C).


Graph (B). Relative Reduction in R, shows the corresponding relative change in the ratio R=P(K)/P(1). Because P(1) increases while the peak power remains unchanged, the relative change in R decreases exponentially with increasing Δf, Eq. (2).


Graph (C). Exponential Decline in Fringe Visibility V, shows the implied change in fringe visibility V, Eq. (3). Even small frequency offsets Δf produce large apparent reductions in V, comparable in magnitude to those reported as experimental effects.


These relationships demonstrate that frequency-axis offsets alone are sufficient to reproduce the reported numerical signature of a change in spatial coherence, without any physical modification of the interference pattern.
CONCLUSION
These graphs show that the reported reduction in fringe visibility in the double-slit experiment I reviewed in 2012 can be reproduced by spectral displacement alone. Motivated by the low-frequency gap identified in the 'Evidence' section and discussed below, a shift of as little as one wavenumber is sufficient to generate the same numerical signature in R used in the central experimental inference.
The Low-Frequency Spectral Gap
A visible gap near zero frequency in the published FFT spectrum is inconsistent with what is expected for a digitized diffraction pattern from the reported optical setup. Such a feature is not predicted by standard diffraction theory under the stated experimental conditions and is not explained in the published report.

![Graph E: (A) Exponential decay of R with shift: R≈0.363∙e^(-Δf⁄0.37). Markers denote the unshifted condition (Δf = 0; R ≈ 0.363, ‘away’) and the shifted condition (Δf = 1; R ≈ 0.025, ‘towards’), corresponding to FFT recording sessions without and with attempted mental influence on the diffracted light, respectively. (B) Reinstated FFT spectrum. The 0–1 w/n region shows an approximately linear fall of spectral power, defining logP1. (C) logP1 varies linearly with Δf∈[0,1], consistent with the exponential decay of R observed in panel A.](https://82840952b1.clvaw-cdnwnd.com/448d549c5aed8109384ccb84d1b9ed5e/200000390-67c8667c88/figure%203C-2.webp?ph=82840952b1)
Graphs D & E (*): Controlled frequency-axis offsets (Δf ∈ [0,1]) within the FFT power spectrum is sufficient to reproduce the reported difference in the normalized R measure, with an effect size comparable to that reported in the 2012 double-slit diffraction experiments. Panel C in graph (E) is shown at larger scale above Eq. (1).
This simulation shows that the reported effect size is not specific to a consciousness-related mechanism, because it can be reproduced by spectral displacement alone.
(*) Figures reproduced from the published 2012 double-slit experiment for critical analysis; overlays and annotations were added to enable figure-based estimates.
